
QR Code Marketing Strategy 2026: How to Track Offline-to-Online Conversions
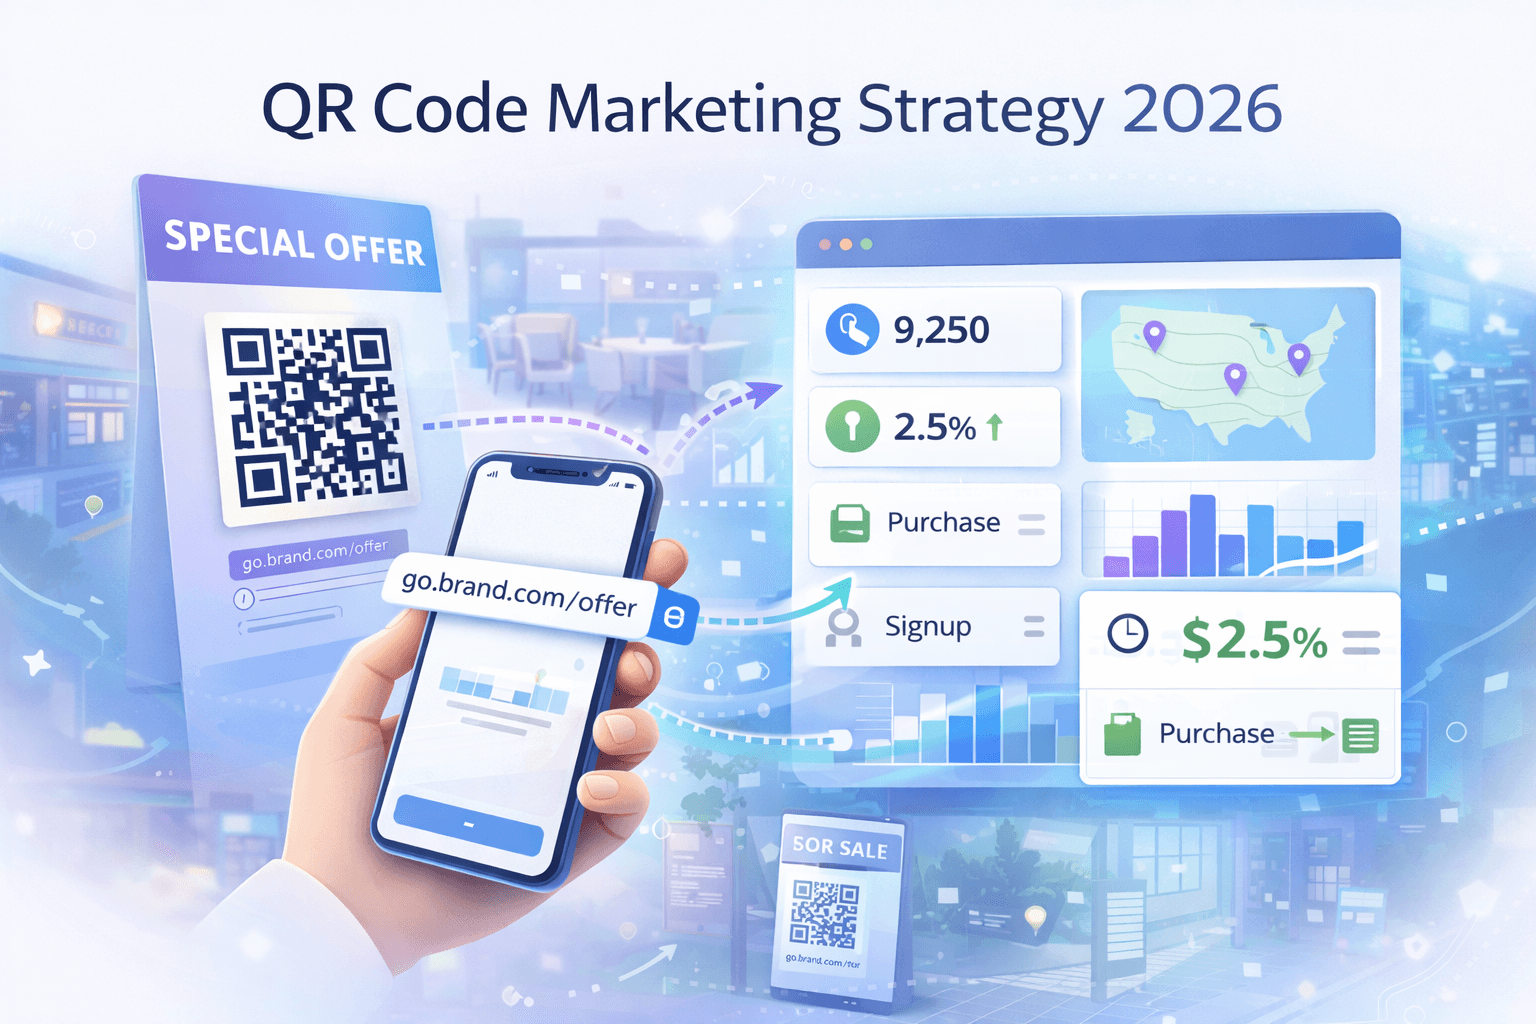
You can track offline-to-online conversions by using dynamic QR codes connected to branded short links with UTM parameters.
which allows you to monitor scan data (location, device, time) and measure conversions through Google Analytics or built-in dashboards.
This setup bridges your physical marketing materials with digital analytics, giving you complete visibility into which offline campaigns drive real online results.

TL;DR
Dynamic QR codes with UTM tracking let you see exactly where scans happen using tools like QR code generator
Use branded short links (like simpleurl.tech) to maintain trust while collecting scan analytics automatically
Connect QR code data to Google Analytics 4 for full conversion tracking from scan to purchase
Update destination URLs anytime without reprinting materials, saving costs and increasing campaign agility
Track metrics that matter: unique scans, scan rate, conversion rate, geographic data, and time patterns
Why QR Code Marketing Matters More in 2026

QR codes connect your physical marketing to digital results. Place them on posters, packaging, or business cards, and you create a trackable path from offline exposure to online action.
The tracking problem:
Without analytics, you cannot answer business-critical questions:
Which poster location drives actual sales?
What time do people scan most?
Do mobile users convert better than desktop?
Which campaign generated revenue versus just curiosity?
The solution:
Strategic QR code implementation with proper tracking turns assumptions into data. You stop guessing and start measuring what actually works.
The Core Components of Trackable QR Codes
Dynamic QR Codes vs Static QR Codes

Static QR codes lock you into a single URL forever. Once printed, you cannot change the destination or track who scans them.
Dynamic QR codes solve both problems:
Change destination URLs anytime without reprinting
Track every scan with detailed analytics
Update campaigns based on real-time performance
Test different landing pages using the same printed code
Always choose dynamic QR codes for any campaign where measurement matters.
Create your trackable QR code and start measuring offline campaign ROI today.
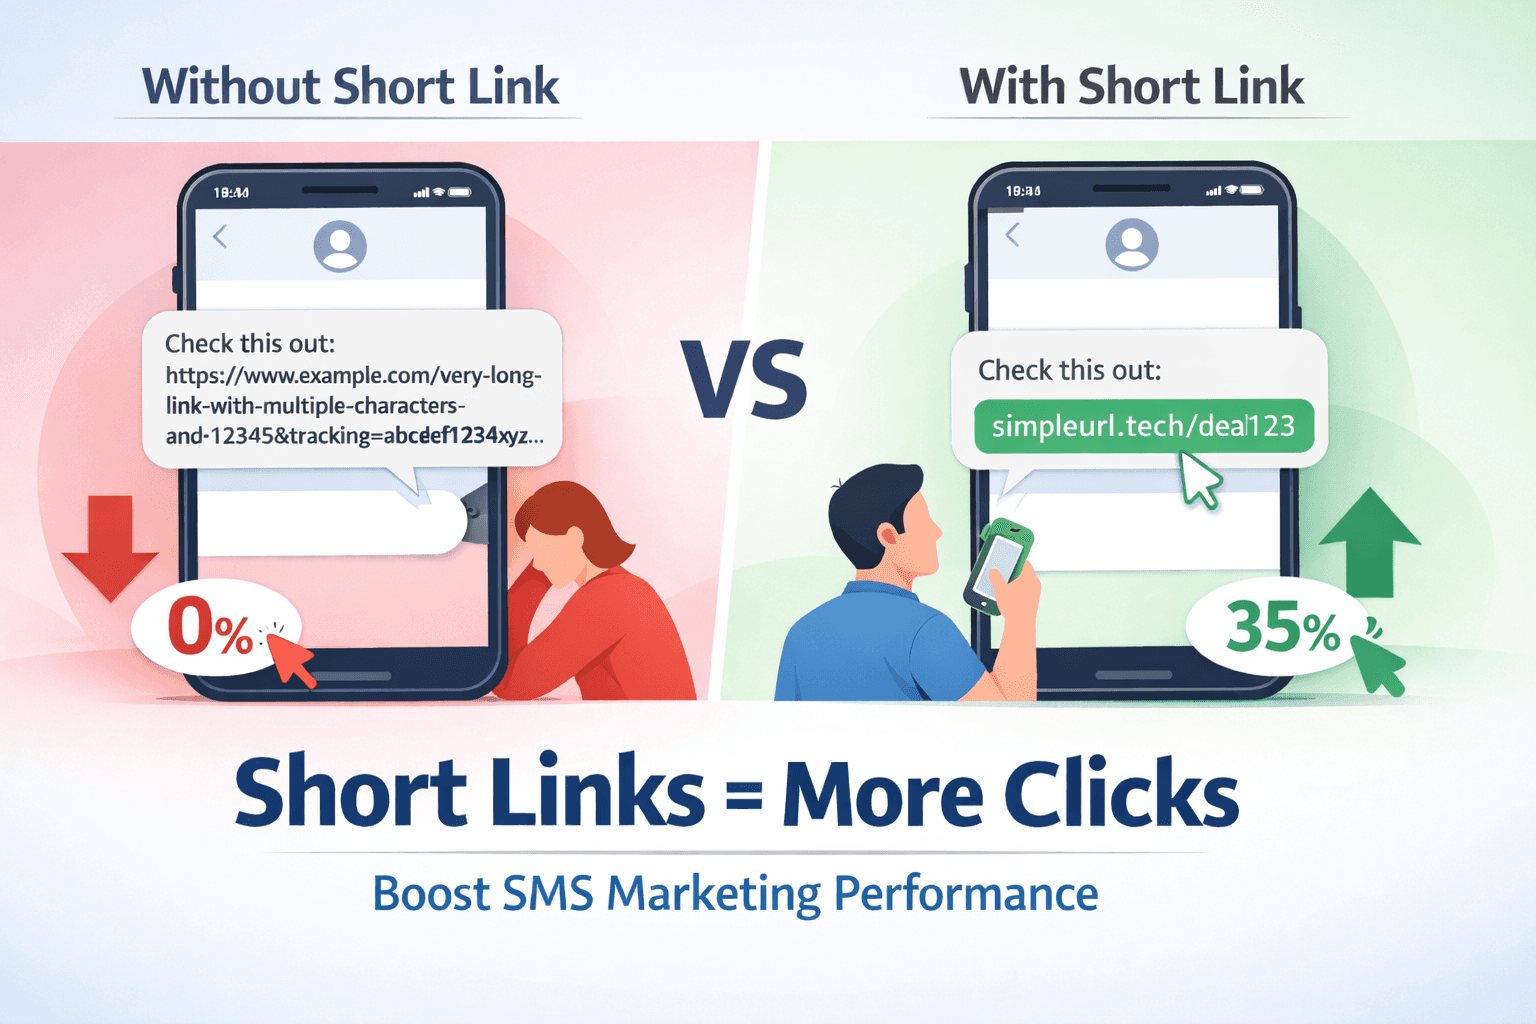
Branded Short Links for Trust and Tracking

Generic QR code generators redirect through unfamiliar domains, reducing consumer trust and scan rates.
Branded short links solve this problem. Using simpleurl.tech, you create QR codes that redirect through your custom domain (like go.yourbrand.com/offer).
Three key benefits:
Trust: Users recognize your domain before clicking, increasing scan confidence
Brand awareness: Every scan reinforces your brand identity
Analytics ownership: Track all data under your brand, not a third-party platform
This approach typically increases scan rates by 30-40% compared to generic shortened URLs. Learn more about branded domains
UTM Parameters for Google Analytics Integration
UTM parameters are tags added to your URLs that help Google Analytics identify traffic sources.
For QR code campaigns, you can use a free UTM builder tool to create these parameters
utm_source: Where the QR code appears (poster, packaging, billboard)
utm_medium: Always set this to "qrcode" for clear identification
utm_campaign: Your campaign name (spring_sale, product_launch)
utm_content: Specific placement or variation (table_tent_a, storefront_nyc)
utm_term: Optional keyword tracking for A/B tests
A properly tagged URL looks like this:
<https://yoursite.com/offer?utm_source=poster&utm_medium=qrcode&utm_campaign=spring_sale&utm_content=downtown_location>
When combined with dynamic QR codes, UTM parameters give you complete visibility from scan to conversion.
To understand UTM parameters in depth, read our UTM parameters guid
How to Set Up QR Code Conversion Tracking

Step 1: Choose Your QR Code Platform
Select a platform that offers dynamic QR codes, branded links, and built-in analytics.
SimpleURL combines all three features, letting you generate QR codes tied to your custom domain while tracking scans by location, device type, and time of day.
Your platform should provide:
Real-time scan monitoring
Geographic data showing city and country
Device breakdown (iOS, Android, desktop)
Time patterns to identify peak engagement hours
Step 2: Build Your Destination URL with UTM Tags
Before generating your QR code, create a UTM-tagged URL using a UTM builder tool.
This step is critical because it connects your offline QR code scans to your Google Analytics conversion goals.
SimpleURL offers built-in UTM builders that simplify this process while ensuring your parameters are formatted correctly.
Step 3: Generate Your Branded QR Code
Create your QR code using your tagged URL. The QR code should redirect through your branded short link, which then points to your UTM-tagged destination.
This structure gives you two layers of tracking:
Platform analytics from the short link
Google Analytics data from the UTM parameters
Learn how to track every click with analytics for complete visibility.
Step 4: Set Up Conversion Goals in Google Analytics
Navigate to GA4 and configure conversion events that match your campaign objectives:
Form submissions
Product purchases
Newsletter signups
Video views
App downloads
This allows you to track not just scans, but actual business outcomes.
Step 5: Deploy and Monitor
Place your QR codes on physical materials and monitor performance through your analytics dashboard. Check these metrics regularly:
Total scans and unique scans
Scan rate (percentage of viewers who actually scan)
Conversion rate (percentage of scans leading to desired actions)
Peak scanning times and locations
Device preferences in your audience
Campaign Examples That Drive Results

1. Restaurant Table Tents
A restaurant promoting lunch specials uses QR codes on table tents. UTM tracking reveals that scans peak between 12-2 PM, with the highest conversion rates at corner tables near windows.
Action: Add more QR codes to high-performing table locations and adjust menu recommendations based on scan timing.
2. Retail Store Displays
A clothing brand places QR codes on in-store displays linking to product videos and exclusive online discounts. Geographic analytics show which store locations drive the most online purchases.
Action: Replicate winning display designs in underperforming locations and adjust inventory based on scan patterns.
3. Event Marketing
An event organizer uses QR codes on posters across the city. Scan data reveals that downtown locations generate 3x more registrations than suburban placements.
Action: Reallocate poster budget to high-performing areas and update the destination URL to promote early-bird pricing as the event approaches.
4. Real Estate Property Marketing
Real estate teams add QR codes to "For Sale" signs linking to virtual tours. Time-based analytics show weekend afternoon scans convert 40% better than weekday scans.
Action: Schedule follow-up campaigns targeting weekend scanners with personalized email sequences.
Metrics That Actually Matter
1. Focus on Business Outcomes
Total scan count sounds impressive but means nothing without context. Focus on metrics tied to revenue and business goals:
Conversion rate: Percentage of scans resulting in purchases, signups, or bookings
Cost per conversion: Campaign cost divided by total conversions from QR scans
Revenue per scan: Total revenue generated divided by unique scans
2. Segment Your Data
Generic campaign analytics hide valuable insights. Segment your QR code data by:
Geographic location (which cities or neighborhoods perform best)
Time patterns (weekday vs weekend, morning vs evening)
Device type (mobile vs tablet behavior differences)
Campaign placement (poster vs packaging vs business card)
This segmentation reveals exactly what works and what to scale.
3. Track the Complete User Journey
Use Google Analytics Path Exploration to visualize what happens after the scan:
Do users browse multiple pages or bounce immediately?
Which content keeps them engaged longest?
Where do they drop off before converting?
Understanding the full journey helps you optimize landing pages and reduce friction points.

Common Tracking Mistakes to Avoid
Using static QR codes for campaigns: You lose all tracking capability and cannot update destinations
Skipping UTM parameters: Your QR traffic appears as direct traffic in analytics, making attribution impossible
Linking to homepages: Every QR code should deliver specific, immediate value tied to the physical context
Ignoring mobile optimization: Most scans happen on mobile devices, so landing pages must load fast and display perfectly on small screens
Forgetting to test before printing: Always scan your QR codes with multiple devices before committing to large print runs
Advanced Tracking Strategies

A/B Testing with Dynamic QR Codes
Create multiple QR code variations with different landing pages or offers.
Since dynamic codes let you change destinations anytime, you can test which approach converts best without reprinting materials.
Cross-Channel Attribution
Combine QR code data with your CRM and email marketing platform to track long-term customer value.
A single QR scan might lead to multiple purchases over months.
Retargeting QR Code Scanners
Install tracking pixels on your landing pages to build retargeting audiences of people who scanned but did not convert.
Follow up with targeted ads based on their specific interests.
Use URL shortener analytics to optimize your tests.
Getting Started with QR Code Conversion Tracking
Implementation timeline: Set up tracking before you print materials, not after.
Start small:
Pick one offline campaign (poster, packaging, or event)
Create a dynamic QR code with UTM parameters
Monitor results for 2-4 weeks
Scale what converts, drop what does not
Quick setup with simpleurl.tech:
Generate branded QR codes in under 5 minutes
Track scans by location, device, and time automatically
Connect to Google Analytics for conversion data
Update destination URLs without reprinting
Next step: Create your first trackable QR code at simpleurl.tech and start measuring offline campaign ROI today.
FAQs
1. What is the difference between static and dynamic QR codes for tracking?
Static QR codes cannot be tracked or edited after creation, while dynamic QR codes redirect through a trackable short link that captures scan data (location, device, time) and allows you to change the destination URL anytime without reprinting.
2. How do UTM parameters help track QR code conversions?
UTM parameters are tags added to your destination URLs that tell Google Analytics exactly where traffic came from. When someone scans your QR code, GA4 can track their entire journey from scan to conversion, showing you which specific campaigns and placements drive results.
3. Can I change where my QR code points after printing it?
Yes, but only if you use dynamic QR codes. These redirect through an editable short link, so you can update the destination URL anytime through your dashboard without needing to reprint physical materials.
4. What metrics should I track for QR code campaigns?
Focus on unique scans (not just total scans), scan rate, conversion rate, geographic location, device breakdown, and time patterns. Most importantly, track business outcomes like revenue per scan and cost per conversion rather than vanity metrics.
5. How do I connect QR code scans to Google Analytics?
Create a destination URL with UTM parameters, generate a dynamic QR code for that URL, and ensure your landing page has Google Analytics tracking installed. Your QR scans will then appear in GA4 under Acquisition > Traffic Acquisition filtered by utm_medium=qrcode